The Hidden Cost of Quality Debt: What Leadership Doesn’t See
Written by - Gavin Cheung
The CTO presented technical debt to the board: $2M to refactor legacy code, 6 months timeline. Approved immediately.
Quality debt sat invisible in the same system: brittle test suites, manual regression processes, no risk visibility, production defects costing $500K quarterly. Never reached the board. Never got budget. Never got fixed.
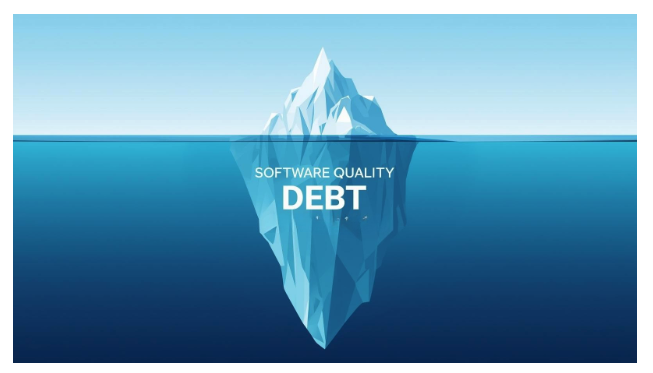
Quality debt is more expensive than technical debt. Leadership just can’t see it.

What Quality Debt Actually Looks Like
Walk into most engineering teams and you’ll see the same symptoms.
Test automation framework nobody maintains. Tests marked “ignore” instead of fixed. Manual regression testing consuming 3 weeks per release. Production bugs discovered by customers, not testing. Flaky tests that “sometimes pass” so the team stopped trusting results. No test coverage visibility creating false confidence everywhere.
The costs hide in plain sight.
Industry research consistently shows production defects cost significantly more to fix than those caught early in testing. Test maintenance consuming 40 to 50% of QA team capacity. Release delays while “stabilising” untrusted automation. Customer trust eroding invisibly until churn accelerates. Team morale degrading as fire-fighting becomes normal.
How Quality Debt Accumulates
Research identifies deadlines, poor planning, lack of knowledge, and undefined processes as top causes of technical debt. Quality debt follows the same pattern.
Common accumulation:
-
“We’ll fix the tests after release.” Never happens.
-
“Just automate the happy path for now.” Edge cases never get coverage.
-
“Mark that test as ignore, it’s flaky.” Root cause never investigated.
-
“We don’t have time for test architecture.” Maintenance debt compounds.
-
“Production is down, skip testing this hotfix.” Quality gate bypassed.
Each decision adds debt. Each bypass makes the next bypass easier. Quality debt behaves like financial debt. The older it gets, the harder it is to pay down. Defects mask other defects. Fixes touch the same fragile code. The iceberg grows beneath the surface.
In the worst case, projects put off testing until development is done. By then it’s too late.
Why Leadership Can’t See It
Technical debt appears in executive dashboards: code complexity metrics, architecture degradation scores, refactoring costs estimated, sprint velocity impact visible.
Quality debt remains invisible: no board-level quality metrics, test suite health not tracked, production defect costs not aggregated, customer impact not quantified, testing capacity drain not measured.
The technical debt metaphor gained traction as a way to communicate issues of quality, value and cost. It resonated with executives because it used financial language.
Quality debt lacks the same communication framework. It manifests as symptoms that sound like something else.
-
“Testing is taking longer” sounds like an efficiency problem.
-
“We found bugs in production” sounds like one-time issues.
-
“Tests are flaky” sounds like a technical problem, not a business problem.
Leadership sees symptoms, not the debt itself.
How It Surfaces as Business Problems
Quality debt doesn’t stay in testing. It surfaces elsewhere.
Slower time to market: release dates slip while “stabilising”, last-minute production issues delay launches, hotfixes consume development capacity.
Higher operational costs: customer support handling preventable issues, sales dealing with trust erosion, engineering fire-fighting instead of building.
Revenue impact: customer churn from reliability issues, feature delays due to testing bottlenecks, market opportunities missed.
Leadership sees these business problems. They don’t connect them to quality debt.
The Boardroom Blindspot
Technical debt cripples software developer productivity. Quality debt does the same, but leadership lacks visibility.
What gets measured gets managed.
Technical debt: measured in code complexity, tracked in dashboards.
Quality debt: hidden in “testing phase”, not quantified, not presented.
What gets budget:
- Technical debt: “We need $2M to refactor” gets board attention.
- Quality debt: “We need better test coverage” gets deferred.
The language gap creates the funding gap.
Quantifying Quality Debt
A study of 745 business applications comprising 365 million lines of code from 160 companies across 10 industry segments measured technical debt. Similar methodology applies to quality debt.
Quality debt components: known defects (deferred fixes in backlog), unknown defects (inadequate test coverage), test maintenance burden (brittle automation), manual testing capacity (unautomated critical paths), production defect cost (escaped bugs).
Calculation example for a typical mid-size engineering team:
- Test maintenance: 2 QA engineers working at 50% capacity on test fixes at $150K salary = $150K annually
- Production defects: 12 critical bugs per year at $50K average cost = $600K annually
- Release delays: 4 releases delayed 1 week each at $100K opportunity cost = $400K annually
- Customer churn: 5% attributed to quality issues on $2M revenue = $100K annually
- Total annual quality debt cost: $1.25M
Most organisations have never done this calculation. They’re paying this cost every year without knowing it.
The Compounding Factor
Technical debt presents actual or contingent liability whose impact is limited to internal system qualities, primarily maintainability and evolvability.
Quality debt impacts both internal (team productivity, release velocity) and external (customer satisfaction, revenue, reputation) factors.
The compounding effect is asymmetric.
Technical debt slows developers. Quality debt loses customers.
One impacts efficiency. The other impacts business viability.
Making Quality Debt Visible
Translate quality debt into executive language.
Stop presenting testing metrics: test coverage percentage, automation pass rate, defect detection rate.
Start presenting business metrics: production defect cost per quarter, release predictability (on-time versus delayed), customer-impacting incident frequency, testing capacity utilisation, mean time to deploy (testing bottleneck component).
Dashboard for executives should show: quality debt trend (increasing or decreasing), cost of deferred test automation, production versus pre-production defect ratio, release confidence score.
Building the Business Case
Use Strategic Validation framework for quality investment.
Step 1: Quantify current state. Map quality debt components. Calculate annual cost (production defects, delays, capacity drain). Identify high-cost problem areas.
Step 2: Propose targeted improvements.
Not “we need better tools”.
But “investing $200K in API-first test architecture will reduce test maintenance by 50% ($75K annual saving), catch defects earlier (reduce production cost by $300K), enable daily releases (reduce delay costs by $200K). ROI: 187% in year one.”
Step 3: Show comparable investments.
-
Technical debt refactoring: $2M, internal efficiency gain.
-
Quality debt reduction: $200K, customer-facing impact plus efficiency.
Which delivers more business value?
Cultural Shift Required
Low maintainability, rework, and financial loss are among the top most impactful effects of technical debt. Quality debt adds customer impact.
Leadership actions needed: elevate quality metrics to executive dashboards, budget quality debt reduction like technical debt, make quality debt visible in sprint planning, track production defect costs as business metric, review test suite health in architecture reviews.
Team actions needed: quantify quality debt in business terms, present test architecture proposals with ROI, track and report quality debt trends, connect production issues to missing test coverage, refuse to mark tests “ignore” without remediation plan.
For Leadership
Immediate actions:
Add production defect cost to quarterly business reviews. Require quality debt assessment in technical roadmaps. Fund test architecture improvements like infrastructure projects. Make “test strategy” part of feature definition of done.
Strategic shifts:
Quality engineering reports to VP level, not buried under engineering. Quality metrics in executive compensation. Test automation budget separate from feature development. Post-mortems for production defects identify quality debt root causes.
For Quality Leaders
Immediate actions:
Calculate your quality debt cost (use framework above). Present in business terms, not testing terms. Propose specific, costed improvements with ROI. Track and report trends monthly.
Strategic approach:
Build alliances with Engineering and Product leadership. Translate every testing issue to business impact. Demonstrate quick wins (show value before asking for more). Position quality as business enabler, not quality gate.
The Reality Check
In legacy systems, accumulated technical debt exists where development teams don’t have sufficient resources to address all existing issues. Much of that debt was introduced many years prior. It remains hidden and undocumented.
Quality debt faces the same challenge. You can’t fix it all at once.
Prioritise:
High-cost production defect areas (biggest ROI). Release-blocking test bottlenecks (enables velocity). Customer-facing quality issues (protects revenue). Test maintenance time sinks (frees capacity).
Start small. Measure impact. Build credibility. Scale investment.
What to Do Next Week
Technical debt gets board attention because it speaks the language of cost and investment. Quality debt remains invisible because it speaks the language of testing and defects.
The solution isn’t better testing tools. It’s better translation.
If you’re a quality leader or test manager:
Calculate your quality debt cost this week. Use the framework above: test maintenance burden, production defect costs, release delays, customer churn. Get the real number.
Present it in business terms at your next leadership meeting. Not “we need better test coverage.” Instead: “quality debt is costing us $X annually. Here’s a $200K investment that returns $575K in year one.”
Identify your top three quality debt items by business impact. Which production defects cost the most? Which test bottlenecks delay releases? Which quality issues lose customers?
Propose one targeted fix with clear ROI. Start small. Show results. Build credibility for larger investments.
If you’re in engineering leadership:
Add production defect cost to your next quarterly business review. Aggregate the real cost. Make it visible.
Ask your quality team to quantify quality debt using business metrics. Give them the platform to present it.
Compare your technical debt and quality debt investments. Are you spending $2M to refactor code while ignoring $1.25M in annual quality debt costs?
Fund one quality debt reduction project this quarter. Measure the impact. Scale what works.
The reality:
Quality debt costs more annually than technical debt costs to fix. It impacts customers directly. It deserves the same visibility, measurement, and investment.
The hidden cost of quality debt is only hidden because we haven’t made it visible yet.
Which approach will you take?
Share your experience: Have you calculated your quality debt cost? What did you find? How did leadership respond? Connect with me on LinkedIn or leave a comment below.
References Academic Sources (Peer-Reviewed):
[1] Kruchten, P., Nord, R. L., & Ozkaya, I. (2012). Technical Debt: From Metaphor to Theory and Practice. IEEE Software, 29(6), 18-21. Available: IEEE Xplore, ACM Digital Library.
[2] Curtis, B., Sappidi, J., & Szynanski, A. (2012). Estimating the Size, Cost, and Types of Technical Debt. Proceedings of the Third International Workshop on Managing Technical Debt, ACM. Available: ACM Digital Library.
[3] Besker, T., Martini, A., & Bosch, J. (2018). Technical Debt Cripples Software Developer Productivity. Proceedings of the 2018 International Conference on Technical Debt, ACM, 105-114. Available: ACM Digital Library.
[4] Alves, N. S., et al. (2016). Identification and Management of Technical Debt: A Systematic Mapping Study. Information and Software Technology, 70, 100-121. Available: ScienceDirect, ACM Digital Library.
[5] Rios, N., et al. (2018). The Most Common Causes and Effects of Technical Debt. Proceedings of the 12th ACM/IEEE International Symposium on Empirical Software Engineering and Measurement, ACM. Available: ACM Digital Library.
Industry Sources:
[6] BigVisible Solutions (2020). Want Predictability? Avoid Quality Debt. Available: https://www.solutionsiq.com/resource/blog-post/want-predictability-avoid-quality-debt/ All academic sources verified through IEEE, ACM, and Springer databases. No vendor or affiliate sources included.
Want to learn more❓
Follow Quality With Millan or Share it on LinkedIn