k6 - web dashboards + HTML report 📊
Written by - Millan Kaul
Imagine running a test and having the ability to visualize and monitor its results in real-time. That’s exactly what the k6 web dashboard offers. As your test progresses, the dashboard provides a dynamic overview of the performance metrics observed by k6. This real-time feedback can be a game-changer, allowing you to identify and address potential reliability issues as they occur.
K6
`k6’ is an open-source load testing tool that makes performance testing easy and productive for engineering teams. k6 is free, developer-centric, and extensible. Read more at what is k6?
Use cases of K6 k6 users are typically Developers, QA Engineers, SDETs, and SREs. They use k6 for testing the performance and reliability of APIs, microservices, and websites. Common k6 use cases are:
- Load testing
- Browser testing
- Chaos and resilience testing
- Performance and synthetic monitoring
But this blog post is not related to that. It is dedicated to the latest cool k6 feature in release v0.49.0.
❤️ Free - real time web dashboards 📊 for performance monitoring with an option to save results as HTML report.
What’s New! in release v0.49.0
k6 continues to stand out with its latest feature – a built-in web dashboard that takes real-time monitoring to a whole new level.
Let’s jump straight to it.
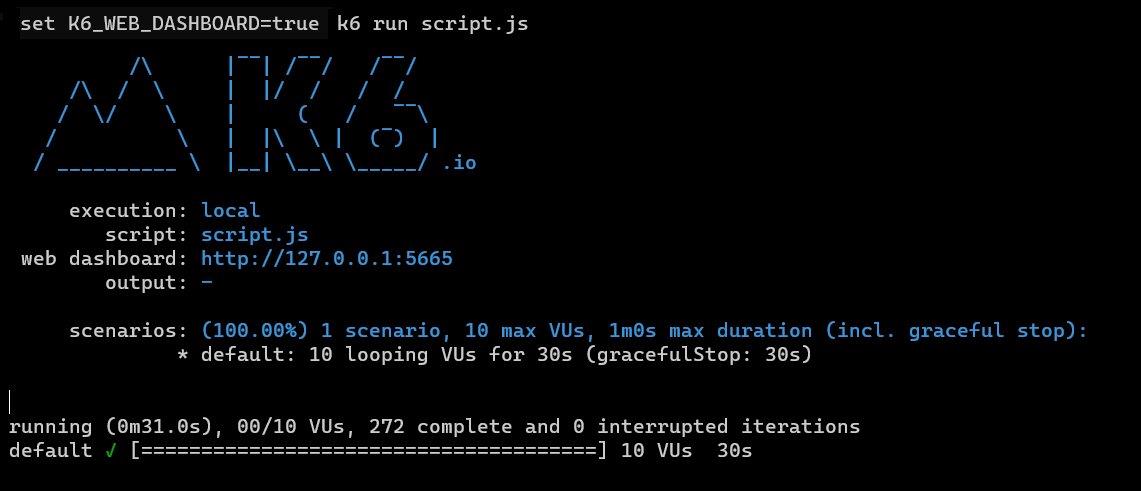
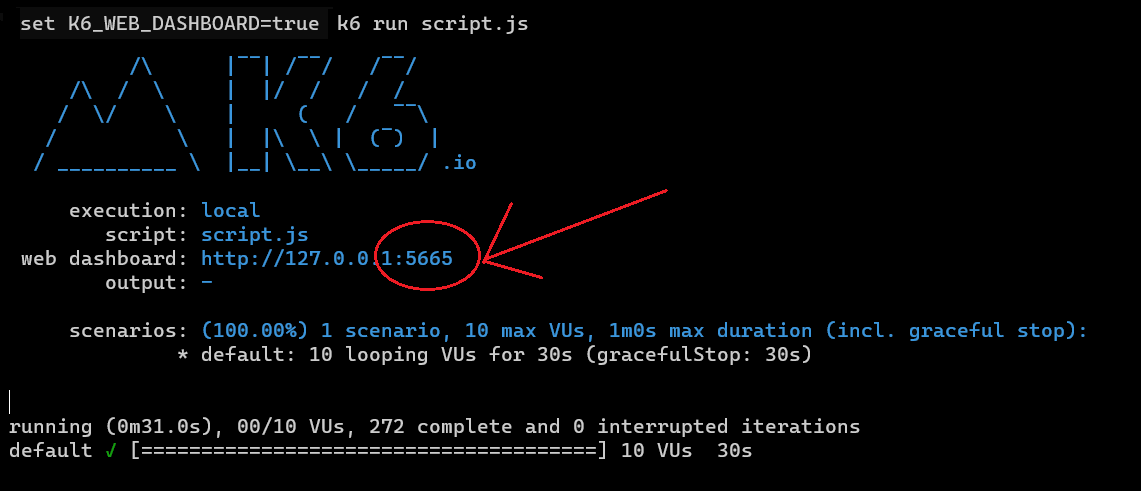
set K6_WEB_DASHBOARD=true and then your k6 command, lets say k6 run script.js
Usual run results on command line
Web (HTML) Dashboards
There are mainly 3 tabs:
1. Overview
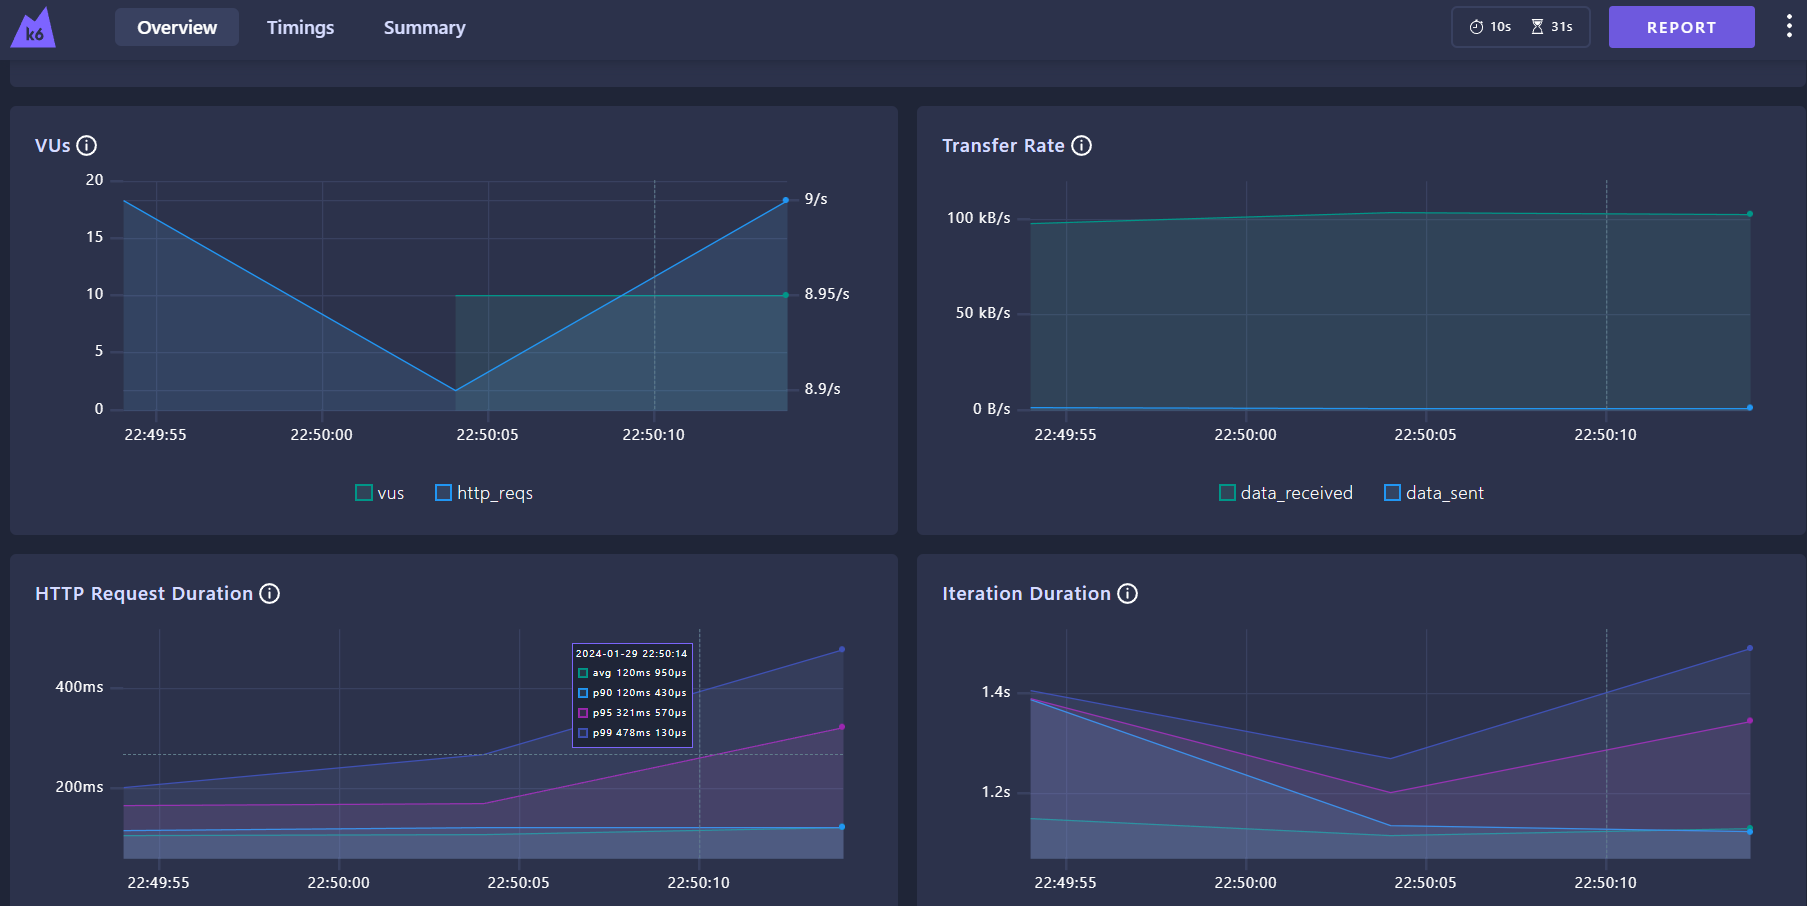
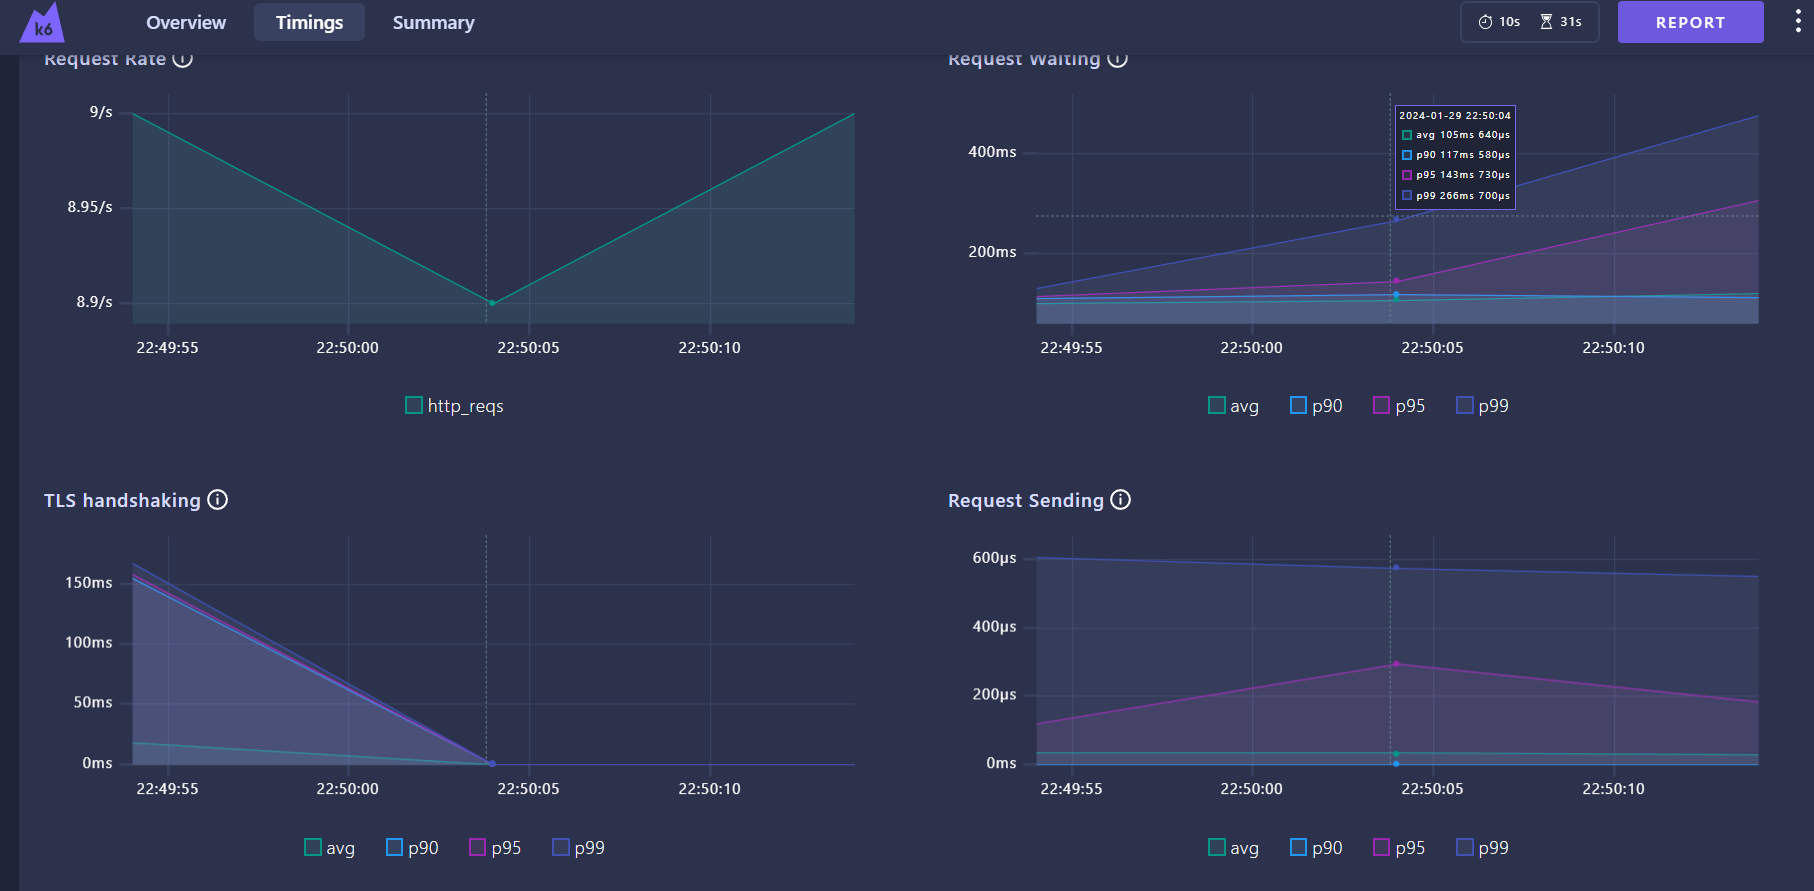
2. Timings
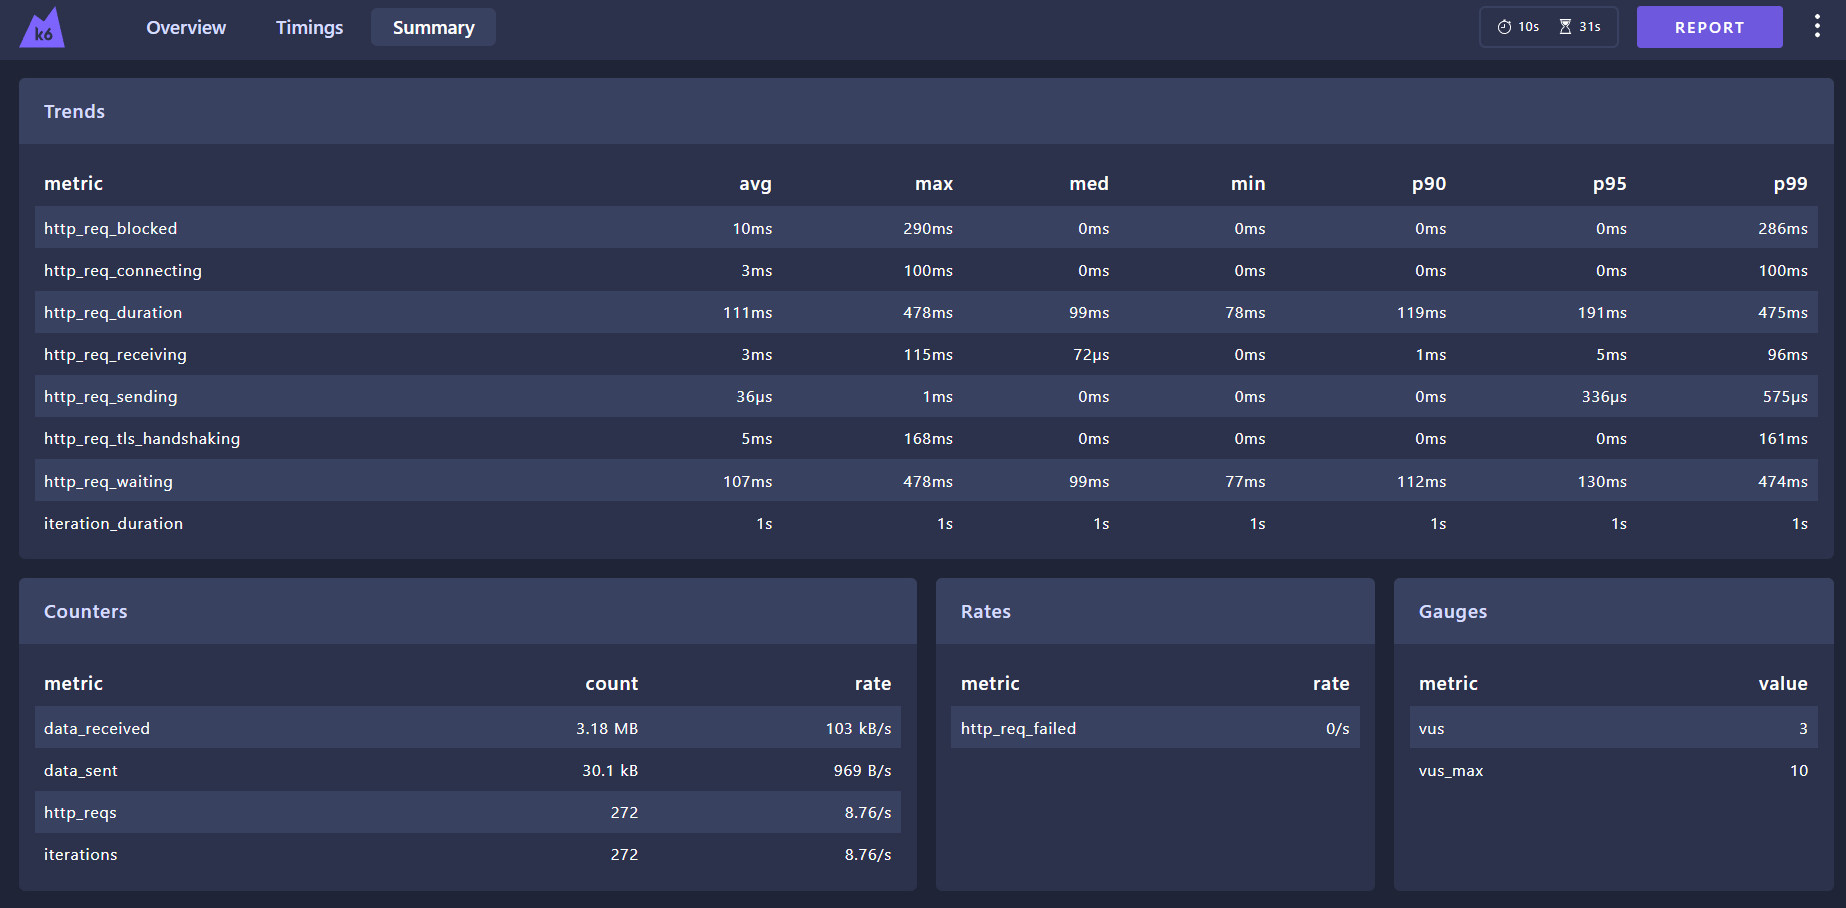
3. Summary
This one is very close to what the json report result would usually look like
Configurable port for web dashbord
By default, the web dashboard is accessible on localhost port 5665.
However, k6 is flexible, and you can customize the host and port according to your preferences.
using K6_WEB_DASHBOARD_PORT you can use your choice of port number to bind the web dashboard to.
HTML repport
This adaptability extends to features like K6_WEB_DASHBOARD_EXPORT.
You can use that by specifying a filename to automatically export the HTML test report at the end of the test run.
It’s worth noting that the default value is empty, meaning the report isn’t exported unless configured otherwise.
for example K6_WEB_DASHBOARD=true K6_WEB_DASHBOARD_EXPORT=html-report.html k6 run script.js
So enabling the web dashboard with K6_WEB_DASHBOARD=true. Simultaneously, specifying the export feature with K6_WEB_DASHBOARD_EXPORT=html-report.html, for HTML test report generation at the end of the test run.
Want to learn more❓
Follow Quality With Millan or Share it on LinkedIn